|
Home
CMS Production
Clean room
MedAustron
HEPHY
testbeams
old
|
|
electronics
module assembly
SiDDaTA
scratch
|
| HEPHY logbook of the Electronics Group |
Not logged in |
 |
|
|
|
Message ID: 14
Entry time: Tue May 20 14:27:50 2008
|
| Type: |
Measurement |
| Author: |
Markus Friedl |
| Project: |
BELLE Upgrade |
| Subject: |
analysis results of source test |
| Object ID: |
micron |
| Measurement Type: |
source |
| Run Number: |
|
|
|
*** NOTE: AFTER THIS MEASUREMENT WE REALIZED THAT BIASING WAS NOT DONE PROPERLY
          HENCE THE RESULTS BELOW ARE NOT RELIABLE
          (in fact it is surprising that they are not worse) ***


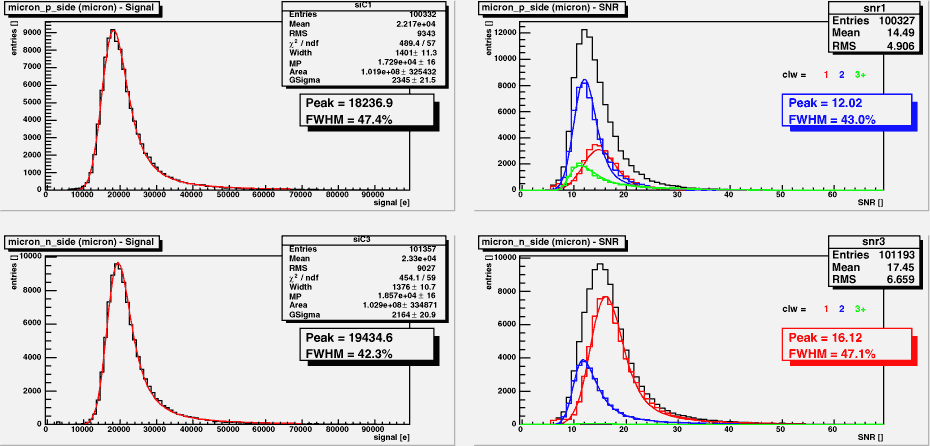
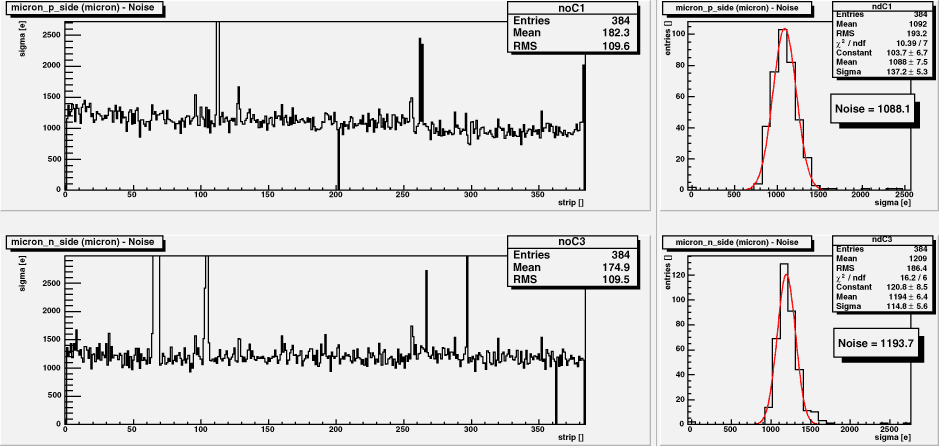
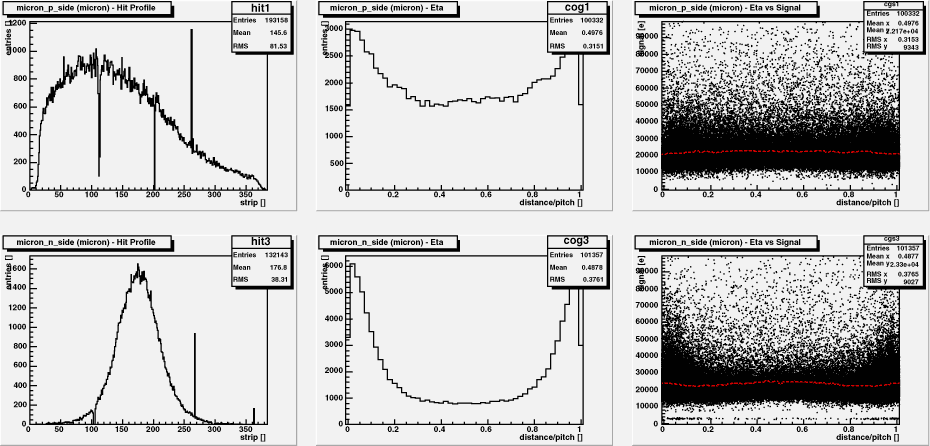
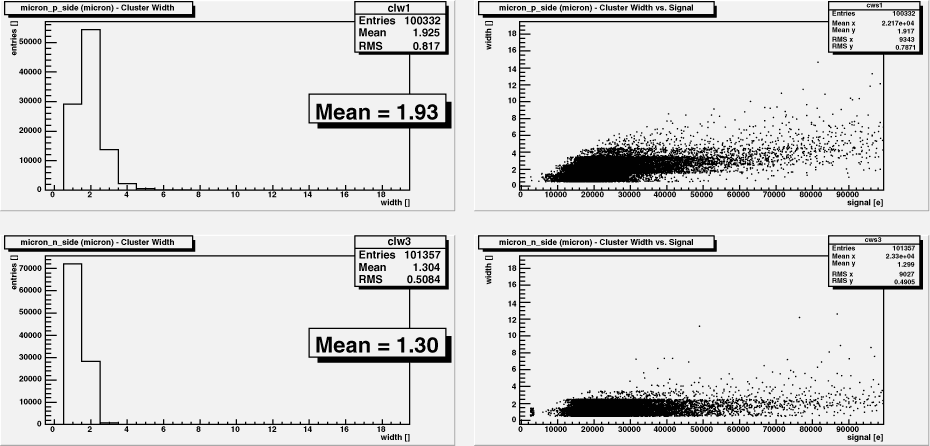
Please find the results of the lab source test on the new Micron module here.
It is read out with 3 + 3 APV chips on either side.

Results table of the source measurement:
                      p-side     n-side
 Cluster signal [e]    18361      19434
 Strip noise [e]        1142       1193
 Avg cluster width      1.91       1.30
 Single strip SNR       16.1       16.3
 Cluster SNR            11.6       14.3
 Strip pitch [um]       50.0      153.5

Apparently, the double metal capacitance is not so bad as expected, even though the Micron sensor does not use
the hourglass crossing scheme. Presumably the dielectric between metal 1 and 2 is rather thick (several um).
Strip noise is roughly the same on both p and n side, so the difference in Cluster SNR (*) only stems from the
unequal cluster width (which is a result of the different pitches).

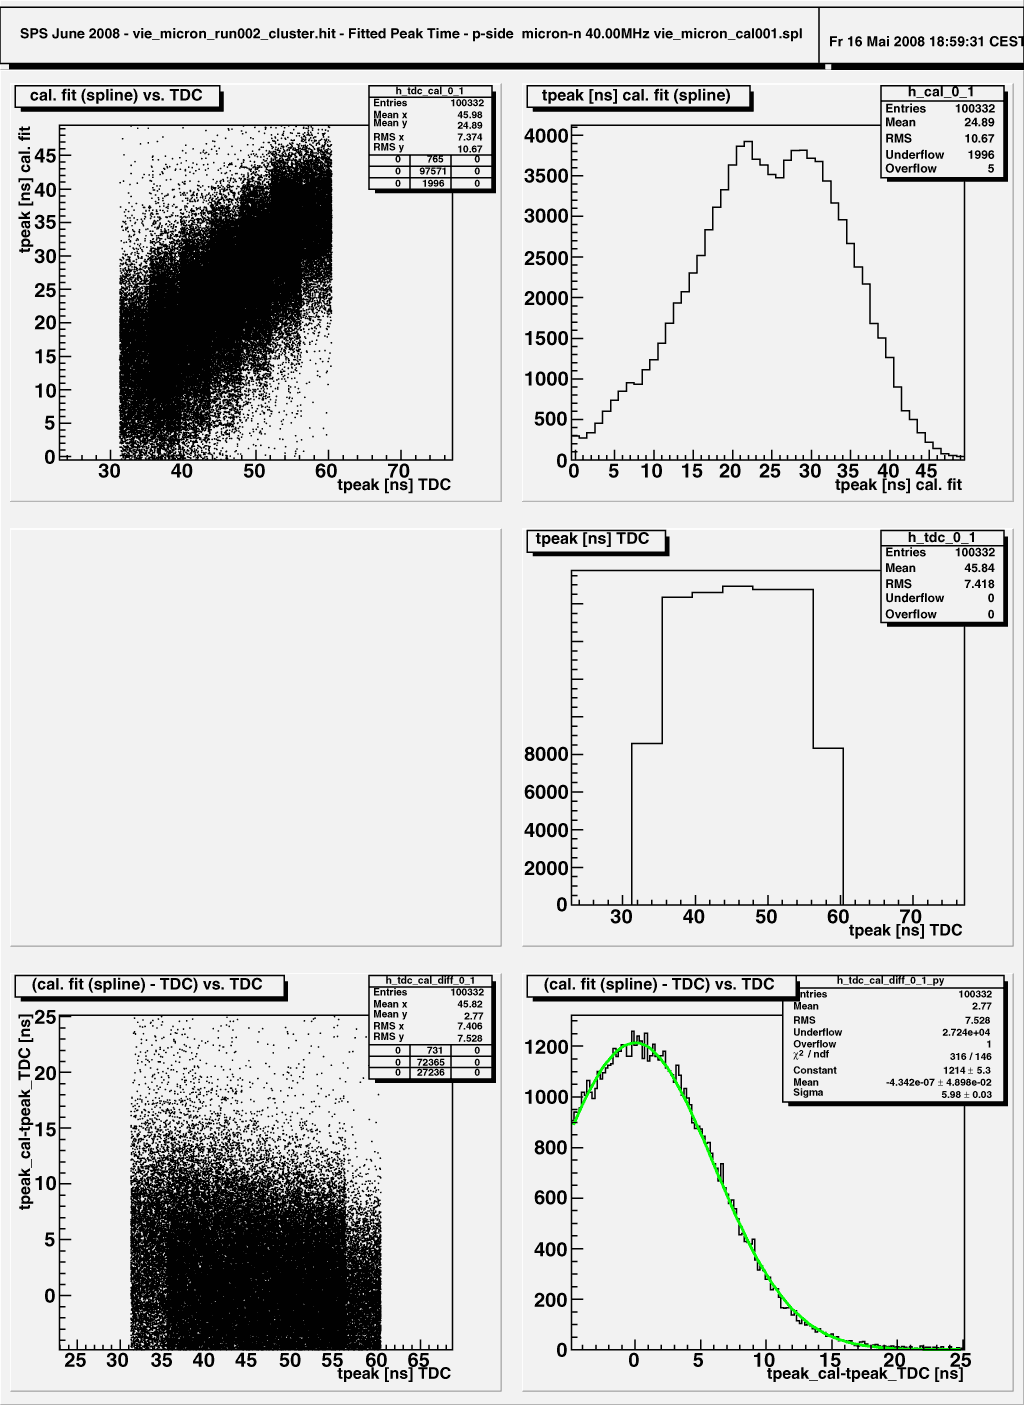
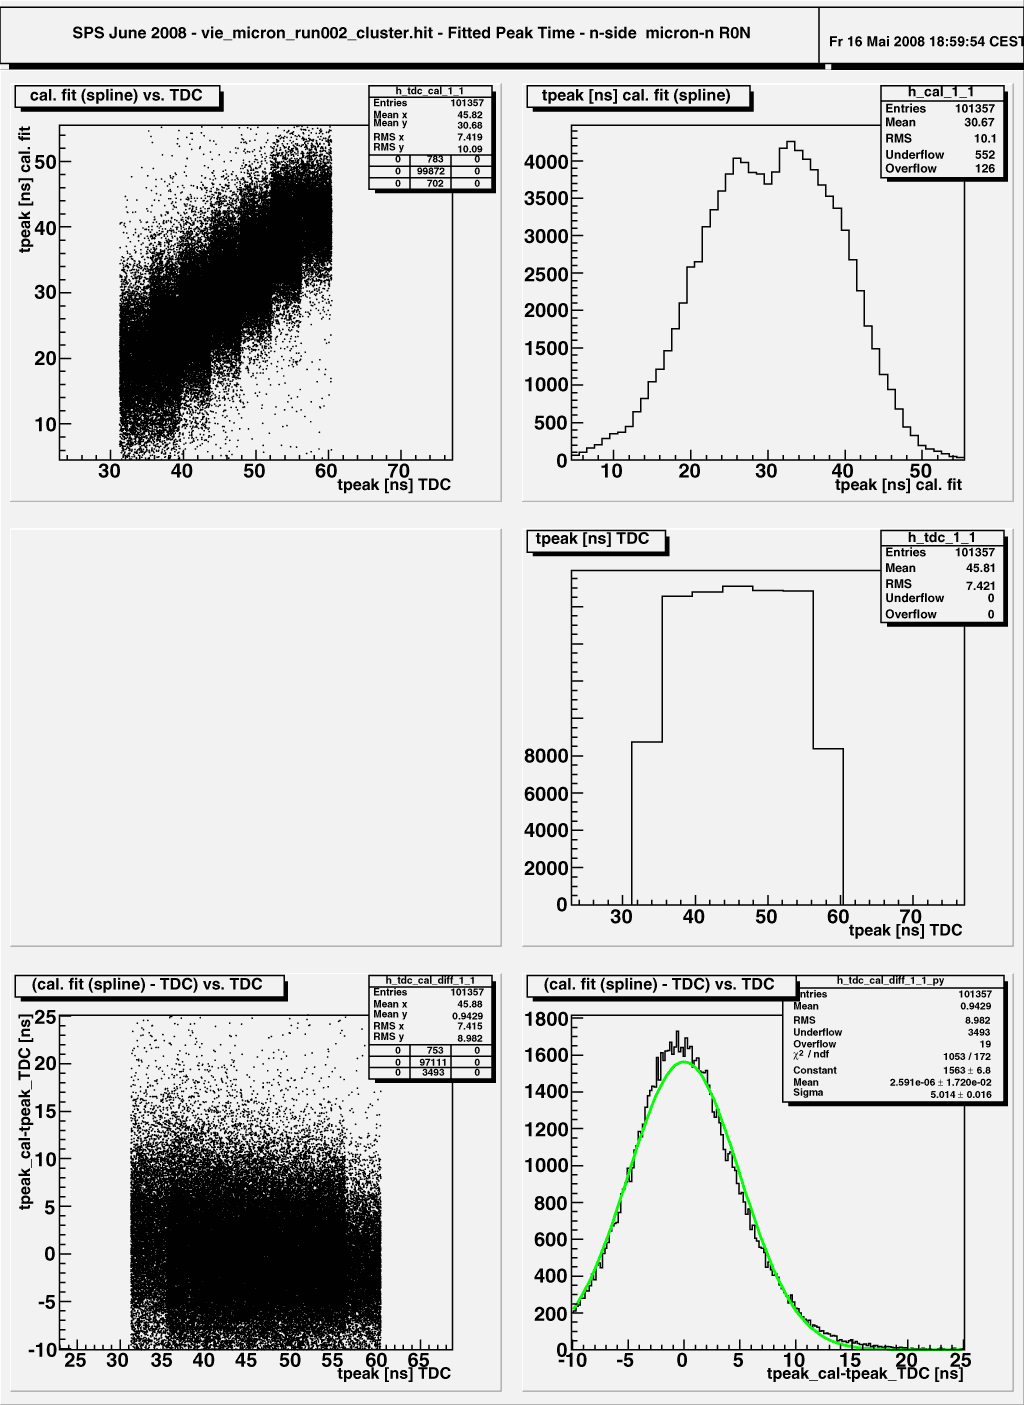
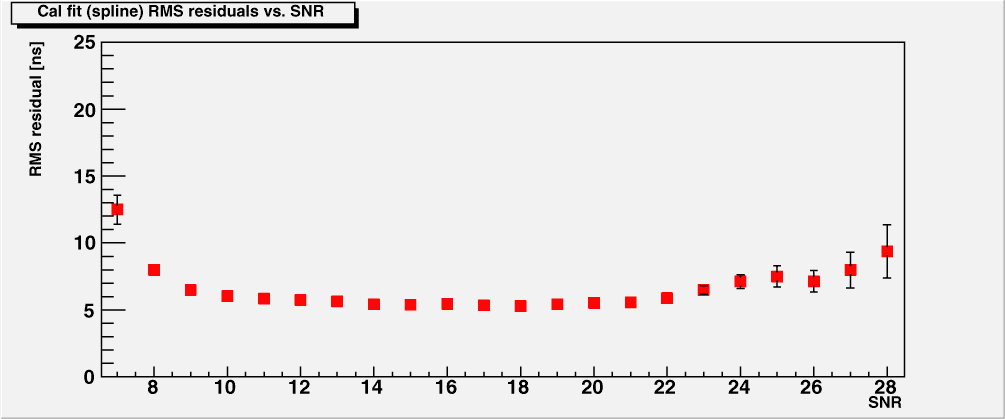
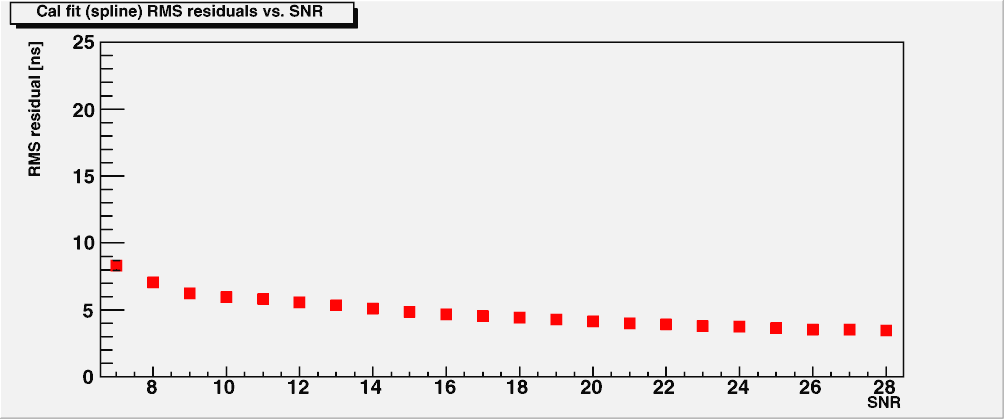
Peak time precision vs SNR (last plot below) is worse compared to the values obtained with various HPK sensors
in the November 2007 beam test at KEK. However, this is a comparison of source and beam and thus might not be
significant. Let's see what we will get in the SPS beam test next week.

(*) Cluster SNR := sum(signal) / (strip_noise * sqrt(cluster_width) ) |
|
|
|
|
|
|
|
|
|
|
|
|
|
|
|
|
|